Flow Meter Straight Length Requirements by Type, with ISO 5167 Tables

Contents

Flow meter straight pipe upstream and downstream length requirements diagram

Why Velocity Profile Decides the Required Straight Run

Every flow meter that infers volumetric flow from a velocity measurement assumes a fully developed turbulent velocity profile — a symmetric paraboloid with the peak at the pipe centerline. Anything that disturbs that profile — an elbow, valve, reducer, pump — introduces swirl and asymmetry that biases the reading by several percent. The fix is straight pipe: enough length downstream of the disturbance for friction at the wall to re-symmetrize the flow.

How much straight pipe depends on what the meter actually senses. A magnetic flowmeter integrates velocity across the whole pipe cross-section and tolerates moderate asymmetry. A vortex meter watches a single shedding point and dies on swirl. A Coriolis tube measures mass directly and does not care about profile at all. The numbers below come from the manufacturer manuals and ISO 5167.

Straight Length by Flow Meter Type

Meter typeUpstreamDownstreamReason
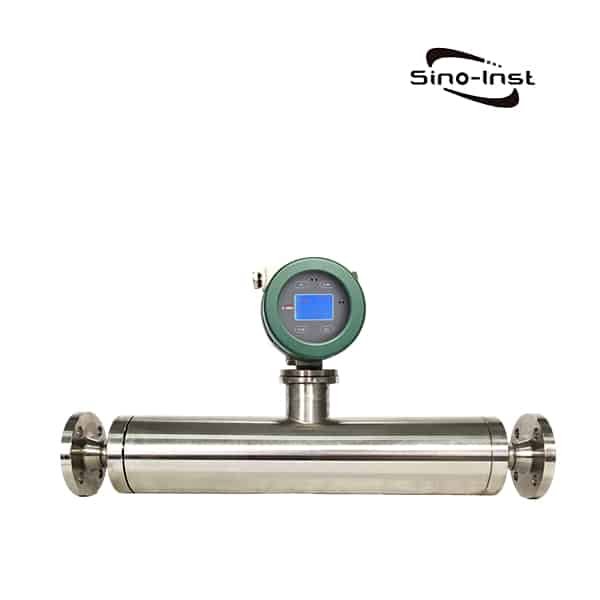
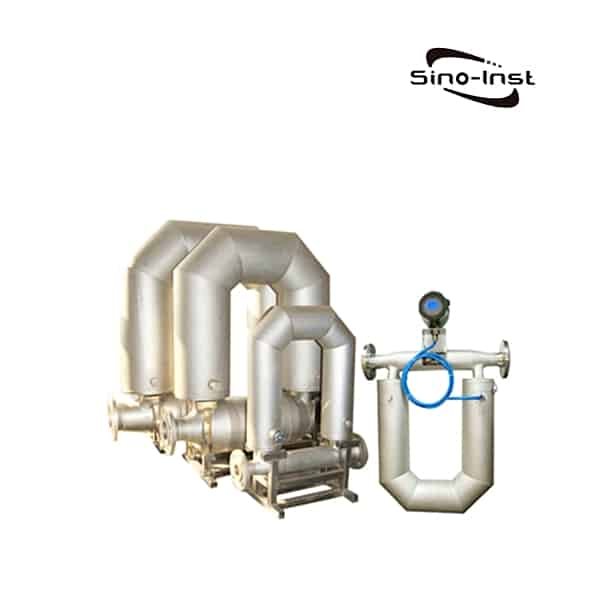
Coriolis (mass)0 D0 DMeasures mass via tube vibration; profile irrelevant
Magnetic (magmeter)5 D2–3 DIntegrates velocity across full cross-section
Ultrasonic, multi-path inline10 D5 DPath averaging tolerates moderate distortion
Ultrasonic, clamp-on retrofit20 D5 DTwo-path cannot compensate for swirl
Vortex shedding15–25 D5 DSingle shedding point destroyed by swirl
Thermal mass (gas)15 D5 DSingle insertion point; needs symmetric profile
Turbine10 D5 DRotor balance depends on profile uniformity
Orifice plate10–44 D4–7 DSee ISO 5167-2 (β-dependent)
Venturi tube5–10 D4 DSmooth contour forgives some distortion
V-Cone / averaging pitot0–3 D1 DBuilt-in flow conditioning

D is the pipe inside diameter. A 200 mm magmeter needs 1.0 m upstream and 400–600 mm downstream — a manageable footprint. A 200 mm vortex meter in the same line needs 3–5 m upstream and 1 m downstream. The vortex meter often loses on installation cost alone for retrofit jobs. For the legacy general rule on 10D/5D, see our companion guide on upstream and downstream straight pipe.

ISO 5167 Lengths for Differential Pressure Elements

Differential pressure elements — orifice plates, nozzles, Venturi tubes — have published straight-length tables in ISO 5167 that vary with β (throat-to-pipe diameter ratio). Excerpt for a single 90° elbow upstream of an orifice plate:

βUpstream (D)Downstream (D)
0.20104
0.40145
0.50185
0.60266
0.67367
0.75447

Higher β means a larger orifice bore relative to pipe size, which keeps the discharge coefficient under tighter tolerance — but only if the velocity profile is undisturbed. Pick a smaller β (say 0.45 instead of 0.65) and the straight-pipe budget drops dramatically. For Venturi tubes the numbers are smaller — 5 to 10 D upstream depending on the disturbance type — because the smooth convergent cone tolerates more profile asymmetry. See our deeper guide on the Venturi tube for the geometry and standards reference.

Upstream Disturbance Multipliers

The straight-length table above assumes one 90° elbow upstream. Other disturbances need more:

  • Two 90° elbows in the same plane: 1.5× the base value
  • Two 90° elbows in perpendicular planes: 2× the base (severe swirl)
  • Reducer (2D long, concentric): 0.5× the base value
  • Expansion (2D long): 1.0× the base value
  • Fully open gate valve: 1.0× the base value
  • Half-open globe or ball valve: 2–3× the base value
  • Pump discharge (centrifugal): 2× the base value

The dominant offender is two elbows out of plane. The first elbow creates a centerline shift; the second adds swirl on top. Even a vortex meter that gets 25D upstream of a single elbow may need 40–50D after two perpendicular elbows. A common field fix is to insert a flow conditioner in the upstream straight section — which buys back roughly half the required length.

Flow Conditioners as a Compensation Strategy

When the available straight run is half what the meter demands, install a flow conditioner upstream of the meter and downstream of the disturbance. Three common types:

  • Tube bundle (19-tube or 7-tube): kills swirl, restores symmetric profile in 4–5D. Adds 1–2 kPa pressure drop.
  • Etoile or AMCA vane: radial vanes break swirl in 2–3D. Lower pressure drop than tube bundle but less effective on asymmetric profiles.
  • Perforated plate (Zanker, Mitsubishi, NOVA): creates jets that recombine into symmetric profile in 8D. Standard for fiscal custody-transfer orifice metering per AGA-3.

The conditioner does not eliminate the straight-pipe budget. It compresses it. A vortex meter that would need 25D upstream of an elbow can be installed with 8D + a 1D Zanker plate + 4D, total 13D. Pressure drop is the trade — 5–20 kPa added at typical flows. For DP-element math underneath all of this, see our DP transmitter explainer.

Measuring Straight Length the Right Way

Two field-measurement mistakes lose money:

  • Counting from the wrong reference. Upstream length is measured from the downstream face of the disturbance (end of elbow weld, downstream of valve flange) to the front face of the meter primary element. Not centerline to centerline.
  • Ignoring intermediate fittings. A tee or instrument tap inside the “straight” pipe section is a new disturbance. Restart the count.

Downstream length runs from the back face of the meter to the next disturbance. Most meters care less about downstream than upstream, but a too-short downstream run can drive cavitation back into the meter on liquid service. For installations where there is genuinely no room, our DP transmitter installation guide covers the impulse-line solutions that DP elements can use in tight spaces.

Common Mistakes That Wreck Accuracy

MistakeTypical biasFix
Vortex meter installed 5D after an elbow (needs 25D)5–15% reading errorAdd 20D or install flow conditioner
Orifice β = 0.7 with only 10D upstream (table says 36D)3–8% over-readReduce β to 0.45 or move meter
Ultrasonic clamp-on right after a pump (needs 20D + conditioner)2–5% drift, swirl-dependentUse inline spool-piece ultrasonic instead
Tee inside the “straight” sectionRandom 1–4% noiseReroute tee or restart length count from tee
Pipe diameter at flange not matching meter boreEdge step bias 2–4%Use a 2D concentric reducer 5D upstream
Reading from centerline to centerline instead of weld facesApparent compliance, real 10–15% under-lengthField-measure from disturbance face

For a quick reference on a related rule-of-thumb question — what is K-factor and why straight-pipe affects it — see our piece on flow meter K-factor.

Short-Run Flow Meter Alternatives

Magnetic Flow Meter

DN10 to DN3000 | 5D up / 3D down | ±0.5% — tolerates short straight runs on conductive liquids: water, slurry, acids.

Vortex Flow Meter

DN15 to DN300 | needs 15–25D up / 5D down | ±1% — steam, gas, condensate where Coriolis is too expensive.

Wedge Flow Meter

DN15 to DN1200 | needs only 4–6D up | ±1% — heavy oil, slurry, dirty service where orifice plate plugs.

For installations where straight pipe is truly impossible — closely spaced manifolds, retrofit jobs in cramped equipment skids — Coriolis mass flow is the safest answer. Send pipe size, fluid, flow range, available straight length, and disturbance type (elbow, valve, pump) to our engineering team via the form below and we will spec a meter for the geometry you have.

FAQ

How much straight pipe does a magnetic flow meter need?

Per the manufacturer manuals: 5 pipe diameters upstream and 2 to 3 pipe diameters downstream from the nearest disturbance. A 200 mm magmeter needs about 1.0 m straight upstream and 400–600 mm downstream. Magnetic flow meters tolerate short runs because the electrode array averages velocity across the full pipe cross-section.

What is the straight length requirement for a vortex flow meter?

15 to 25 pipe diameters upstream depending on the disturbance type, and 5 diameters downstream. A single elbow is 15D, two elbows out of plane is 25D, half-open valve is 30D+. Vortex meters react badly to swirl because they sense vortex shedding at a single bluff body and any swirl shifts the shedding frequency.

Do Coriolis flow meters need straight pipe?

No. Per ISO 10790, Coriolis meters have no straight-pipe requirement for accuracy because they measure mass directly through tube vibration and are insensitive to velocity profile distortion. The only installation rule is to keep the tubes full of liquid (no air pockets, no entrained gas).

How do you measure straight pipe length for a flow meter?

From the downstream face of the disturbance (elbow weld face, valve flange) to the front face of the meter primary element. Not centerline to centerline. Any intermediate fitting — tee, tap, reducer — restarts the count. Downstream length is measured from the back face of the meter to the next disturbance.

Can a flow conditioner replace straight pipe?

It can reduce the required straight length by 40–60%, not eliminate it. A 19-tube bundle or Zanker plate installed downstream of a disturbance restores a symmetric velocity profile in 4–8D, so a vortex meter that would need 25D upstream of an elbow can run on 8D + conditioner + 4D. The trade is 5–20 kPa added pressure drop at typical flows.

Request a Quote

Please enable JavaScript in your browser to submit the form

Ultrasonic Level Transmitter Installation: Dead Zone, Beam Angle & 5-Step Mounting

Contents

Why Geometry Decides Accuracy

An ultrasonic level transmitter sends a pulse, listens for the echo, multiplies travel time by the speed of sound, and divides by two. The math is simple. What goes wrong in the field is almost always geometry: the sensor mounted too close to the maximum liquid level, too close to a tank wall, aimed at an agitator, or staring into a foam blanket. Get the install right and accuracy lands inside ±0.25% of range; get it wrong and the reading drops out or sticks at one value. For comparison with other tank gauging methods, see our overview of ultrasonic tank level sensors.

This guide walks through the geometry rules — dead zone, beam angle, clearance, false echoes — and finishes with a six-step calibration procedure that works for any 40, 75, or 120 kHz transducer. For a deeper background on how the sensor itself works, see our explainer on ultrasonic level transmitters.

Blanking Distance: Sizing the Dead Zone

The blanking distance (also called the dead zone or near zone) is the volume directly in front of the transducer where no measurement is possible. The transducer needs time to stop physically vibrating after each transmit pulse before it can listen for the returning echo. Read inside the blanking distance and you get the transducer’s own ring-down, not the liquid surface.

FrequencyTypical rangeTypical blankingBeam angle
40 kHz0.3 – 8 m0.3 m (12 in)10°–12°
75 kHz0.25 – 5 m0.25 m (10 in)8°–10°
120 kHz0.2 – 3 m0.15 m (6 in)6°–8°
200 kHz0.1 – 1.5 m0.1 m (4 in)5°–6°

Sizing rule: the maximum liquid level must sit at least one blanking distance below the transducer face. For a 40 kHz sensor with 300 mm blanking installed on a 6 m tank, the highest accepted level is 6.0 − 0.3 = 5.7 m. Operators usually add another 100–200 mm of safety margin because waves and turbulence push the apparent surface upward.

Five-Step Mounting Procedure

  1. Confirm the mounting flange location. The sensor face must be at least one blanking distance above the highest expected level. For roof-mounted installs on closed tanks, use the NPT or flange already specified for the model. Hand-tighten threaded sensors — overtightening cracks the housing.
  2. Verify perpendicularity. The transducer face must aim straight down within ±2°. A 1 m offset at 5° tilt loses 70% of return signal strength. Use a small bubble level on the threaded boss before final tightening.
  3. Check clearance to the nearest wall or fitting. Half-beam-angle clearance is the minimum (see calculation in next section). On a 6 m tank with a 40 kHz sensor, that means staying 0.6 m from the wall.
  4. Cable the transducer with shielded twisted pair. Run separately from variable-frequency-drive cables to avoid EMI pickup. Ground the shield at the controller end only.
  5. Energize and check the empty echo. With the tank empty, the displayed level should read maximum range. If the screen shows “lost echo,” the sensor is either aimed at a fitting or above its rated range.

Beam Angle and Clearance Math

The ultrasonic beam spreads as a cone. The half-angle θ/2 gives the minimum clearance to any wall, ladder, or pipe inside the tank. The footprint radius at a sensing distance d is:

r = d × tan(θ/2)

For a 75 kHz sensor with a 9° total beam (4.5° half angle) at 4 m range:

r = 4 × tan(4.5°) = 4 × 0.0787 = 0.315 m

So nothing — ladder, baffle, internal nozzle, agitator shaft — can be within 315 mm of the beam axis at 4 m below the sensor. Anything inside that cone returns an echo that the transmitter cannot distinguish from the liquid surface. Most false-echo problems trace back to engineers using only the centerline distance and forgetting the cone.

Avoiding False Echoes from Internals and Foam

Sources of false echo, ranked by how often we see them:

  • Internal ladders or piping inside the cone. Either reposition the sensor or program a “ignore echo” zone at the offending distance.
  • Foam or floating crust. Standard ultrasonic does not see through more than 50 mm of dense foam. Switch to guided wave radar or a stilling well if foam is persistent.
  • Agitator turbulence. Mount at least one tank diameter away from the impeller swirl, or use a stilling well (seamless PVC pipe, 100 mm diameter, with a ¼” vent hole drilled within the blanking distance and ¼” holes at the bottom for liquid flow).
  • Dome-top tanks. Echoes bounce around the dome and arrive late. Never mount in the center of a dome — offset by at least one tank radius.
  • Steam, dust, or temperature gradients. All change the speed of sound and bias the level reading. A 50 °C temperature drift introduces about a 7% level error if not compensated.

For deep tanks with internal obstructions, our guide on stilling well design covers the hole pattern math and pipe-sizing rules that also apply to ultrasonic sensors.

Outdoor Installation: Sun, Wind, Rain

Outdoor installations punish ultrasonic sensors three ways. Direct sunlight on the transducer face raises the sensor body 10–20 °C above ambient and shifts the speed-of-sound compensation. Wind blows the sound wave off centerline above 30 km/h, causing intermittent lost echoes. Rain creates a curtain of point reflectors between sensor and liquid. For diesel and fuel tanks specifically, see our notes on checking level in underground tanks.

Mitigations: a 200 × 200 mm aluminum sunshade mounted 100 mm above the sensor cuts the thermal swing in half. A short PVC stilling well (4× sensor face diameter, 1 m long, vented at the top) handles all three problems together. For wastewater and chemical tank applications, see the non-contact liquid level sensor guide for material compatibility notes.

Commissioning: 6 Calibration Steps

  1. Set sensor type. In the transmitter menu, pick the actual transducer model so dead zone, max range, and beam angle defaults load correctly.
  2. Enter tank height (zero reference). Measure with a steel tape from the sensor face to the tank floor. Enter this as the 4 mA point.
  3. Enter the empty distance. Distance from sensor face to the lowest expected liquid level. This usually equals tank height minus the desired low alarm volume.
  4. Enter the full distance. Distance from sensor face to the highest expected liquid level (which must be at least one blanking distance below the sensor). Enter as the 20 mA point.
  5. Run the echo map. Most modern transmitters scan the empty tank once to record fixed obstruction echoes for masking. Run this with the tank fully drained.
  6. Verify with a wet test. Fill the tank to two known levels (typically 25% and 75%) and compare the displayed value against a sight glass or dipstick. Adjust 4 mA / 20 mA span if error exceeds ±0.5% of range.

For 4-20 mA loop verification math, our piece on how transmitters generate the 4-20 mA signal covers loop power and scaling.

Common Installation Mistakes

MistakeSymptomFix
Sensor below blanking distance from max levelFrozen reading at max range, surge near fullRaise mounting flange or switch to higher-frequency sensor
Mounted in center of dome topErratic reading, jumps every few secondsOffset to one tank radius from center
Cable run beside VFD cablePeriodic noise spikesReroute through separate conduit, ground shield once
No temperature compensationSteady drift with ambient or process temperatureEnable built-in temp comp or wire external RTD
Aimed at agitatorLost echo or wrong levelAdd stilling well or relocate
Overtightened threaded bossCracked housing, IP66 failureHand-tight only; teflon tape if needed for seal

For the pressure-based alternative (when foam or steam rule out ultrasonic), see our companion guide on DP transmitter installation.

Ultrasonic Level Sensors from Sino-Inst

HS-2000 External Tank Level Sensor

External-mounted | non-invasive | 0–10 m range | ±0.5% — for closed pressurized tanks where internal mounting is not possible.

807 Low-Temperature Level Sensor

–40 to +80 °C | 0–6 m | IP68 | 4-20 mA — for outdoor and refrigerated tank applications where standard ultrasonic struggles.

Ultrasonic Clamp-on Flow Meter

Transit-time | clamp-on | DN15–DN6000 | ±1% — companion ultrasonic technology for pipe flow when tank level isn’t the answer.

For sizing, sensor selection, and a tank-specific install drawing, contact our engineering team using the form below. Send the tank height, diameter, contents, mounting nozzle size, and any photos of the top of the tank — we typically reply with a recommended sensor and mounting plan within one business day.

FAQ

What is the blanking distance of an ultrasonic level transmitter?

The blanking distance, or dead zone, is the area directly in front of the transducer where no measurement is possible because the transducer is still vibrating from the transmit pulse. Typical values: 100 mm for a 200 kHz sensor, 300 mm for a 40 kHz sensor. The maximum liquid level must sit at least one blanking distance below the sensor face.

How high above the liquid should an ultrasonic level sensor be mounted?

At a minimum, one blanking distance above the highest expected liquid level. For a 40 kHz sensor (300 mm blanking) on a tank that fills to 5.7 m, mount the sensor at 6.0 m. Add 100–200 mm safety margin for surface waves and turbulence.

Why does my ultrasonic level transmitter show “lost echo”?

Three most common causes: the sensor is tilted more than 2° off perpendicular, foam or floating crust is blocking the return echo, or an internal fitting (ladder, agitator, nozzle) sits inside the beam cone. Check perpendicularity with a bubble level first, then map the cone footprint for obstructions.

Can ultrasonic level transmitters work outdoors?

Yes, with three precautions: a sunshade above the transducer to limit thermal drift, a short stilling well to block wind and rain, and ensuring the temperature compensation is enabled (a 50 °C ambient swing introduces about 7% level error without compensation).

How do I calibrate an ultrasonic level transmitter?

Six steps: (1) set sensor model, (2) enter tank height as the 4 mA reference, (3) enter empty distance, (4) enter full distance as the 20 mA point, (5) run the echo map with the tank drained to mask fixed obstructions, (6) fill to a known level and verify against a sight glass — adjust span if error exceeds ±0.5% of range.

Request a Quote

Please enable JavaScript in your browser to submit the form

Venturi Tube Working Principle, Bernoulli Math & ASME Specs

Contents

What a Venturi Tube Does

A venturi tube is a short pipe section with a narrowed middle, used to measure fluid flow rate by sensing the pressure drop across the constriction. The device was described by Italian physicist Giovanni Battista Venturi in 1797 and remains one of the most accurate primary elements for measuring water, steam, oil, and gas flow.

Three sections do all the work: a converging inlet that accelerates the fluid, a cylindrical throat where pressure reaches its lowest value, and a diverging outlet that recovers most of the kinetic energy as static pressure. Two pressure taps — one upstream, one at the throat — feed a differential pressure transmitter that outputs a 4–20 mA signal proportional to the square root of flow.

You will see venturi tubes in municipal water mains, power plant feedwater lines, chiller plants, custody-transfer crude oil headers, and wherever pumping cost makes the pressure loss of an orifice plate unacceptable.

The Venturi Effect and Bernoulli Equation

The physics is one equation. For an incompressible, steady, frictionless flow along a streamline, Bernoulli’s equation between the upstream tap (section 1) and the throat (section 2) gives:

P₁ + ½ρv₁² = P₂ + ½ρv₂²

Combine with continuity (A₁v₁ = A₂v₂) and you get the working form most engineers use day-to-day:

Q = Cd · A₂ · √[ 2·ΔP / (ρ · (1 − β⁴)) ]

Where Q is volumetric flow (m³/s), A₂ is throat area (m²), ΔP is the measured pressure differential (Pa), ρ is fluid density (kg/m³), β is the throat-to-pipe diameter ratio (d/D), and Cd is the discharge coefficient — typically 0.984 for a classical Venturi with machined convergent and rough cast iron throat per ISO 5167-4. The β⁴ term in the denominator is the velocity-of-approach correction; you cannot ignore it when β > 0.3.

Anatomy of a Classical Venturi Tube

Three sections by length and angle:

  • Convergent cone: total included angle 21° ± 1°. Length about 2.7 × (D − d).
  • Throat: length equal to the throat diameter d. Two diametrically opposed pressure taps (or four equispaced taps connected to a piezometer ring) sit at the midpoint.
  • Divergent cone: total included angle 7° to 15°. Shorter angles recover more pressure but add cost and weight; 7° is the textbook value for maximum recovery.

The upstream pressure tap sits at a distance of ½D from the start of the convergent section. This is the geometry of the “classical” Venturi tube as defined in ASME MFC-3M. Get the cone angles wrong and the discharge coefficient drifts outside the standard’s ±0.7% tolerance, requiring individual calibration.

Five Venturi Tube Designs by Geometry

DesignConstructionTypical βCdUse case
Classical machinedBronze or stainless, machined convergent0.4–0.750.995Lab, custody transfer
Classical rough castCast iron, as-cast convergent0.3–0.750.984Large water mains
Classical welded sheetFabricated steel, β-ring throat0.4–0.70.985Power plant feedwater
Short-form (Herschel)Shortened divergent, 21° angle0.4–0.70.97–0.99Tight installations
RectangularFlat-sided, non-circularvaries0.95–0.99HVAC ducts, open channels

The short-form (Herschel) Venturi trades 5–10% of pressure recovery for half the lay length. That tradeoff often makes sense in retrofit jobs where there is no room for a 5-meter classical tube. The rectangular variant shows up in HVAC supply ducts and water canals where a circular flow element does not fit. For more on duct-mounted DP sensing, see our guide on static vs dynamic pressure.

Worked Flow Calculation: From ΔP to Q

Water at 20 °C flows through a 200 mm classical Venturi with a 100 mm throat. The DP transmitter reads 25 kPa. What is the flow rate?

  • D = 0.200 m, d = 0.100 m, so β = 0.5
  • A₂ = π × (0.100)² / 4 = 0.007854 m²
  • ρ = 998 kg/m³ (water at 20 °C)
  • ΔP = 25,000 Pa
  • Cd = 0.984 (rough cast convergent per ISO 5167-4)
  • 1 − β⁴ = 1 − 0.0625 = 0.9375

Plug in: Q = 0.984 × 0.007854 × √[ (2 × 25,000) / (998 × 0.9375) ] = 0.984 × 0.007854 × √(53.45) = 0.984 × 0.007854 × 7.311 = 0.0565 m³/s ≈ 203 m³/h.

Throat velocity v₂ = Q / A₂ = 0.0565 / 0.007854 = 7.2 m/s, which is well inside the 1.5–10 m/s sweet spot for Venturi tubes. Below 1.5 m/s, DP gets noisy. Above 10 m/s, you start seeing cavitation risk on the throat for liquids. For the DP side of the math, our explainer on how DP transmitters work covers signal conditioning.

Venturi vs Orifice Plate vs Flow Nozzle

ParameterClassical VenturiOrifice PlateFlow Nozzle
Permanent pressure loss5–20% of ΔP40–95% of ΔP30–80% of ΔP
Discharge coefficient0.984–0.9950.60–0.620.93–0.99
Accuracy (uncalibrated)±0.7%±0.6%±1.0%
Turndown ratio3:1 to 5:13:1 to 5:13:1 to 4:1
Straight pipe upstream5–10 D10–44 D10–30 D
Capital cost (200 mm)$$$ (high)$ (low)$$ (mid)
Best forLarge lines, slurriesClean fluids, retrofitSteam, high temperature

The orifice plate wins on price and is fine when you do not care about pump head. The Venturi wins when permanent pressure loss costs real money — a 1000 mm water main saving 20 kPa year-round is worth tens of kilowatts of pump power. Flow nozzles fit in between, popular for high-temperature steam where orifice edge wear becomes a calibration problem. For thicker comparison content, see our piece on flow meter K-factor.

ASME MFC-3M and ISO 5167-4 Standards

Two documents govern Venturi tube design and calibration:

  • ASME MFC-3M-2004: “Measurement of Fluid Flow in Pipes Using Orifice, Nozzle, and Venturi.” Defines convergent angle 21° ± 1°, divergent angle 7° to 15°, throat surface roughness, and the Cd equations.
  • ISO 5167-4:2022: “Measurement of fluid flow by means of pressure differential devices — Part 4: Venturi tubes.” Sets the diameter range 50 mm ≤ D ≤ 1200 mm and Reynolds number range 2×10⁵ ≤ Re ≤ 2×10⁶ for uncalibrated use.

Outside those bounds — small lines, low flows, high-temperature gas, or β below 0.3 — you cannot use the tabulated Cd. The tube must be wet-calibrated on a flow rig traceable to NIST. Calibration adds about $3,000–$8,000 to a 200 mm classical Venturi.

Installation: Straight Runs and Tap Orientation

The Venturi is forgiving compared with an orifice plate, but it still needs straight pipe:

  • 5 D upstream of a single 90° elbow
  • 10 D upstream of two elbows in perpendicular planes
  • 20 D upstream of a partly closed valve
  • 4 D downstream before any disturbance

Pressure tap orientation depends on the fluid. For clean liquids, taps at 3 and 9 o’clock (horizontal pipe). For gas with possible condensate, taps at 12 o’clock. For steam, taps at 3 and 9 with condensate pots installed below. Get this wrong and you get either a slugged transmitter or a permanently water-logged impulse line. Our DP transmitter installation guide covers impulse line slopes and 3-valve manifold sequencing.

For straight-pipe rules of thumb on every meter type, see our flow meter straight pipe guide.

Pressure Recovery: Venturi’s Energy Advantage

The diverging cone is where Venturi tubes earn their cost. By gradually expanding the flow from throat to pipe diameter at a 7° included angle, the fluid decelerates without turbulent separation and most of the kinetic energy converts back to static pressure. Typical permanent pressure loss is 10% of the measured ΔP at β = 0.5, dropping to 5% at β = 0.7. Compare that with an orifice plate at the same β, which dumps 70–95% of ΔP as friction loss.

Over a year, a 600 mm Venturi at 0.5 m/s saving 15 kPa of pump head represents roughly 4 kW of continuous pump power. At $0.12/kWh that is about $4,200 per year — payback on the Venturi premium often inside 2 years. This is the math behind every chilled water plant retrofit replacing orifices with Venturis.

Cleaning Venturi Tubes (Industrial + BBQ Grill)

Two completely different cleaning jobs share the name. The industrial Venturi flow meter rarely needs cleaning if the fluid is clean; for slurries or scaling water, a yearly inspection and high-pressure rinse of the throat are normal. Pressure taps are the failure point — they plug with debris and bias the reading low. Most modern Venturis include flush connections on the tap legs.

Gas grills are the other context. Each burner has a small Venturi tube where propane or natural gas accelerates and pulls in primary air. Spiders love these tubes; webs and egg sacs block airflow and produce yellow flames or backfiring. To clean a grill Venturi: shut off gas, remove the burner, slide the Venturi off the orifice spud, push a pipe cleaner or bottle brush through the tube, blow out with compressed air, reassemble. Inspect every spring before first use.

Venturi Flow Meters from Sino-Inst

Venturi Flow Meter

DN50 to DN1200 | β 0.4–0.75 | ±0.5% — classical and short-form geometries for water, oil, gas service.

Verabar Flow Meter

Averaging pitot | hot tap insertion | low pressure loss — alternative to Venturi for large pipes with retrofit constraints.

V-Cone Flow Meter

Conditioning DP element | 0–3D straight run | tolerates swirl — compact replacement for Venturi in tight installations.

For sizing help or a quotation on any of these flow elements, contact our engineering team using the form below. Provide pipe size, fluid, design flow, and operating pressure-temperature; we typically reply within one business day.

FAQ

What is a venturi tube used for?

Measuring flow rate by sensing the pressure drop across a constricted throat. Common applications are municipal water, power plant feedwater, chilled water HVAC, oil custody transfer, and grill burner air entrainment.

How does a venturi tube work?

The fluid accelerates through a converging cone, causing static pressure to drop in the throat (Bernoulli’s equation). A DP transmitter reads the pressure difference between upstream and throat taps; volumetric flow is proportional to the square root of that differential.

How do you clean venturi tubes on a gas grill?

Shut off the gas, lift out the burner, slide the Venturi tube off the orifice spud, push a long-handled bottle brush or pipe cleaner through the tube to remove spider webs and debris, blow clean with compressed air, and reassemble. Inspect every spring before the first cookout.

What is the difference between a venturi tube and an orifice plate?

Both create a differential pressure for flow measurement. A Venturi recovers most of the pressure (5–20% permanent loss) thanks to its diverging cone; an orifice plate dumps 40–95% as turbulent loss. Venturi costs 5–10× more but pays back in pump energy on large lines.

What pressure recovery does a venturi tube achieve?

About 80–95% of the differential pressure is recovered as static pressure downstream, depending on β (throat/pipe diameter ratio) and divergent cone angle. A β = 0.7 classical Venturi with 7° divergent angle gives roughly 95% recovery, while β = 0.4 at 15° recovers about 80%.

Request a Quote

Please enable JavaScript in your browser to submit the form

Flow Meter K-Factor: Chart, Formula, Calculator & Calibration

The K-factor of a flow meter is the number of output pulses the meter generates per unit volume of fluid. It is the calibration constant that lets a turbine, vortex, or paddle-wheel meter convert its raw frequency into engineering units — gallons per minute, litres per minute, or m³/h. Get the K-factor right and the meter is accurate; get it wrong and the loop is off by the same percentage, every reading, every day.

Contents

K-Factor Defined: Pulses Per Unit Volume

In flow measurement, the K-factor is the proportionality constant between the meter’s pulse-output frequency and the fluid’s volumetric flow rate. Symbolically:

K = pulses / volume

Examples: a turbine meter labelled K = 1000 pulses/litre means every litre of fluid passing through the rotor produces 1000 output pulses. A frequency of 500 Hz therefore corresponds to 500/1000 = 0.5 L/s = 30 LPM. A vortex meter labelled K = 25 pulses/gallon at 100 Hz corresponds to 100/25 = 4 gal/s = 240 GPM.

The K-factor is fixed by the meter’s internal geometry — rotor blade count and pitch for turbines, bluff-body width and pipe ID for vortex shedders, gear teeth count for PD meters. Different sizes and different manufacturers have different K-factors. The number is engraved on the meter body or printed on the calibration certificate.

K-Factor Formula and Units

The defining equation is:

K = f / Q

  • f = output frequency (Hz, pulses per second)
  • Q = volumetric flow rate (L/s, gal/s, m³/s — be consistent)
  • K = K-factor in pulses per unit volume

Common K-factor units:

  • pulses/litre — SI default, used on most European and Asian meters
  • pulses/gallon — US default, can be US or UK gallon (always check)
  • pulses/m³ — utility-scale gas and water meters
  • pulses/ft³ — US gas meters

Mixing up units is the most common K-factor mistake. A K = 100 pulses/gallon entered into a transmitter that expects pulses/litre will under-read by the gallon-to-litre conversion factor — about 3.785× error. Check that the transmitter’s volume unit matches the K-factor unit before commissioning. See our LPM to GPM conversion guide if your pump curve and transmitter speak different units.

K-Factor Chart by Meter Type and Size

Approximate K-factor ranges for common pulse-output meters. Always use the calibration certificate, not these figures — meter-to-meter variation can be ±5%.

Meter TypeSizeK-Factor (pulses/L)K-Factor (pulses/gal US)
Turbine — liquidDN15 (½”)10,000–30,00038,000–113,000
Turbine — liquidDN25 (1″)1,500–3,0005,700–11,400
Turbine — liquidDN50 (2″)200–500760–1,900
Turbine — liquidDN100 (4″)20–6076–227
Turbine — gasDN50–DN15010–20038–760
Vortex (shedding)DN25200–400760–1,515
Vortex (shedding)DN5030–80114–300
Vortex (shedding)DN1502–67.6–23
Paddle wheelDN15–DN5050–2,000190–7,600
Oval gear (PD)DN151,000–5,0003,800–19,000
Oval gear (PD)DN5050–200190–760

Notice the inverse relation to size: smaller meters produce more pulses per unit volume because the rotor or bluff body sees more cycles per unit fluid. A DN15 turbine at 30,000 pulses/L sounds huge until you realize 1 L/min through it is only 500 Hz — well within transmitter range. A DN150 vortex at 2 pulses/L would only fire 30 Hz at 1000 LPM.

K-Factor for Turbine Flow Meters

A turbine meter’s K-factor is set by the rotor — blade count, blade pitch, and the magnetic pickup geometry. The pickup generates one pulse per blade as each one passes under the coil. So a 10-blade rotor at 1000 RPM produces 10,000 pulses/min = 167 Hz. The K-factor is calibrated against a primary standard (gravimetric or piston prover) at one or more flow points and printed on the meter’s certificate.

Key facts:

  • K-factor is most stable in the meter’s linear range — typically 10:1 turndown.
  • Below the low-end cut-off (Re < ~4000), K-factor falls off as bearing friction dominates.
  • Viscosity affects K-factor: 5 cSt vs 50 cSt can shift K by 1–3%. High-accuracy applications use viscosity correction tables or multi-point calibration.
  • Bearing wear is the dominant K-factor drift source over time — schedule recalibration every 12–24 months for custody-transfer service.

For a cryogenic application, see our low-temperature turbine flowmeter page; for upstream straight-pipe rules see flow meter straight pipe requirements.

K-Factor for Vortex Flow Meters

Vortex meters shed alternating vortices behind a bluff body at a frequency proportional to flow velocity (Strouhal number ≈ 0.27 for the standard trapezoidal bluff). The K-factor depends on the bluff body width and the pipe ID:

K = St / (d × A) where St is Strouhal, d the bluff width, A the pipe cross-section.

  • Vortex K-factor is largely independent of fluid type and density once Reynolds > ~20,000 — that’s the meter’s main advantage.
  • Below the linear range (Re < 5,000–20,000 depending on bluff) vortex shedding becomes irregular and K-factor is meaningless.
  • Vortex K-factor does not drift with bearing wear — there are no bearings. But scaling, fouling, or partial bluff blockage will shift it.
  • Two-phase flow (entrained gas in liquid, condensate in steam) can corrupt vortex shedding entirely.
  • Reynolds and the pressure profile across the bluff body are what set the shedding regime — see our static vs dynamic pressure note for the upstream physics.

How to Calculate K-Factor (Step-by-Step)

To calibrate a K-factor from scratch — for example, when the certificate is lost or a meter has been rebuilt — run a master-meter or volumetric prover comparison:

  1. Plumb the meter under test in series with a reference flow standard (master turbine, magmeter, or piston prover).
  2. Stabilise flow at a target point within the meter’s linear range, typically 60–80% of max.
  3. Record total pulses N from the meter under test over a measured volume V from the standard, over at least 60 seconds.
  4. K = N / V. Repeat 3–5 times at the same point, average the results.
  5. For multi-point calibration repeat at 5–7 flow points across the meter’s turndown, fit a polynomial or piecewise-linear correction.
  6. Store K (or the curve) in the flow transmitter or DCS. Document the calibration on the meter tag.

Multi-Point Calibration for ±0.15% Accuracy

A single K-factor is good enough for ±0.5% in the meter’s linear band. For custody-transfer or fiscal metering, single-point K is not enough — the meter’s response curves slightly even within the linear range. Multi-point calibration improves the achievable accuracy to ±0.15% or better.

  • 5–7 calibration points across 10:1 turndown.
  • Modern transmitters store a piecewise-linear or polynomial correction; the DCS reads the corrected flow directly.
  • API MPMS Chapter 5.3 (turbine meter custody transfer) and ISO 4185 specify the procedure for fiscal turbine meters.
  • For pulse meters in process service (not fiscal), single-point K plus annual verification is typically sufficient.
  • For DP-type flow meters (orifice, Venturi, V-cone) the square-root linearisation is part of the loop math — see our linear-to-sqrt converter tool.

What’s a Good K-Factor — Is Higher Better?

A higher K-factor (more pulses per litre) is generally better for low-flow resolution: more pulses per unit volume means finer totalisation and shorter sampling windows for the same accuracy. But there are limits:

  • Above ~10 kHz the transmitter and field wiring start to drop pulses to noise. Match the transmitter’s max input frequency.
  • Very high K-factors on small meters can be misleading — the meter still has a finite turndown and accuracy. A DN15 turbine at K = 30,000 pulses/L is no more accurate than a DN50 at K = 500.
  • “Good” K-factor really means: the meter’s measured pulse rate falls between the transmitter’s minimum sensitivity (typically 1–10 Hz) and maximum (typically 1–10 kHz) across the application’s flow range.
  • If your pipe sizing or pump curve is in different flow units, work in the same unit consistently — our flow rate and pressure note covers the cross-references.

Three Worked Calculation Examples

Example 1 — Liquid turbine, K = 2,000 pulses/L: Output frequency reads 333 Hz. Flow rate Q = f/K = 333/2000 = 0.167 L/s = 10 LPM = 2.64 US GPM.

Example 2 — Vortex meter, K = 32 pulses/L on DN50 line: Frequency reads 96 Hz. Q = 96/32 = 3.0 L/s = 180 LPM = 47.6 US GPM. For LPM↔GPM conversion details, see our LPM to GPM conversion guide.

Example 3 — Paddle wheel meter, K = 500 pulses/gal US: Output reads 250 Hz. Q = 250/500 = 0.5 gal/s = 30 US GPM. To switch the transmitter to LPM, the configuration menu just changes the volume-unit dropdown; K stays the same internally — the firmware applies the unit conversion.

Four Common K-Factor Settings Mistakes

  1. Mixing pulses/L and pulses/gal. A 3.785× error pops up immediately. Always verify the transmitter’s volume unit matches the K-factor’s denominator.
  2. Using the rotor blade count as the K-factor. A 10-blade rotor does not have K = 10 pulses/L. The blade count is just one input; rotor pitch, pickup geometry, and pipe ID all contribute.
  3. Applying the K-factor from a different meter size. K-factors scale roughly as 1/D³ for turbines and 1/D² for vortex meters. The DN25 K is not the DN50 K divided by 2.
  4. Forgetting viscosity correction on high-accuracy turbines. A turbine calibrated on 1 cSt water will read ~2% low on 50 cSt diesel without correction. For non-aqueous service, get a viscosity-specific calibration.

FAQ

What is K-factor in flow measurement?

K-factor is the calibration constant of a pulse-output flow meter, expressed as pulses per unit volume (pulses/L or pulses/gal). The meter’s output frequency divided by K gives the flow rate. It is set by the meter’s internal geometry and calibrated against a reference standard.

How do you calculate K-factor for a flow meter?

K = N/V where N is the number of pulses recorded over a known volume V from a reference standard. Run the meter and reference in series at a stable flow point in the meter’s linear range, total the pulses over 60 seconds or more, repeat 3–5 times, average.

Is a higher K-factor better?

Higher K (more pulses per litre) gives finer low-flow resolution and shorter integration windows. The practical ceiling is the transmitter’s maximum input frequency — typically 1–10 kHz. Above that, pulses are dropped. Higher K does not directly improve accuracy; meter geometry and calibration quality do.

What’s a good K-factor for a flow meter?

The K-factor should put the output frequency between the transmitter’s minimum (often 1–10 Hz) and maximum (1–10 kHz) over the application’s flow range. For most process service that means a few hundred to a few thousand pulses/L; for very small meters it can reach tens of thousands.

What is the K-factor for a turbine meter?

Typical liquid turbine K-factors range from 10,000–30,000 pulses/L at DN15 down to 20–60 pulses/L at DN100. Gas turbines are lower (10–200 pulses/L at DN50–DN150). The exact figure is engraved on the meter or printed on its calibration certificate.

Does K-factor change with viscosity?

Yes for turbine meters — viscosity shifts K-factor by 1–3% between 1 cSt and 50 cSt. For vortex meters K-factor is roughly viscosity-independent above Re ≈ 20,000. For PD meters viscosity affects slip and therefore K slightly. High-accuracy custody work uses multi-viscosity calibration.

Cryogenic Turbine Flow Meter

DN6–DN200 | ±0.5% | Pulse output with stamped K-factor; calibrated for LN2/LOX and other cryogenic fluids.

Helical Gear PD Flow Meter

DN10–DN100 | ±0.5% | High-resolution pulse output for viscous fluids; K-factor stamped on body.

Sanitary Oval-Gear PD Meter

DN15–DN50 | Tri-clamp 316L | Calibrated K-factor for filling, dosing, and sanitary CIP service.

Need a K-Factor Calibrated Meter Quoted?

Send your line size, fluid, viscosity, and flow range to our engineers — we’ll quote a meter with a single- or multi-point K-factor calibration certificate that matches your transmitter’s pulse-input spec.

Request a Quote

Please enable JavaScript in your browser to submit the form

Static Pressure vs Dynamic Pressure (vs Total): HVAC & Pitot

Static, dynamic, and total pressure are three flavours of the same scalar — but they appear at different ports of a Pitot-static probe, drive different process instruments, and trip up new HVAC and fluid-mechanics engineers because the textbook prose hides the practical mapping. This page leads with a three-way comparison table, then walks the formulas, the Pitot anatomy, an HVAC duct traverse example, and what pressure gauges actually read.

Static vs Dynamic vs Total Pressure: Comparison Table

The fastest answer, before any equations. Use this table to decide which port, sensor, and equation matches the engineering problem in front of you.

QuantitySymbolWhat it MeasuresTypical Sensor / PortWhere it Shows Up
Static pressurepsPressure exerted by a fluid at rest on the pipe or duct wall, normal to flowWall tap, gauge transmitter, manometer static legProcess gauges, HVAC duct readings, tank pressures
Dynamic pressureq or pdKinetic energy density of the moving fluid, ½ρv²Pitot-static probe — difference between impact and static portsFlow meters (DP-type), aircraft airspeed, fan curves
Total pressurep0 or ptStatic + dynamic, the energy if the fluid were brought to rest isentropicallyForward-facing impact port (Pitot tube)Aerodynamics, compressor inlet, turbine stages

The defining identity (incompressible, low-Mach): p0 = ps + ½ρv². Knowing any two of the three, you can solve for the third. A Pitot-style averaging probe measures both p0 and ps in the same body and outputs the difference (the dynamic head) to a DP transmitter.

Contents

Static Pressure: Force at Rest on Pipe and Tank Walls

Static pressure is the pressure a fluid exerts perpendicular to a surface that is not moving with the flow — the pipe wall, the duct wall, the diaphragm of a wall-mounted gauge. It exists whether the fluid is moving or stationary. For a fluid at rest under gravity, ps = ρgh; for a closed pressurized tank, it is whatever the regulator allows.

Static pressure is what process gauges, transmitters, and most safety devices read by default. The port faces sideways into the flow, so kinetic energy contributes nothing to the signal. The static port on a Pitot-static probe — those small holes on the side of the probe body — does the same job inside a moving stream.

  • Units: Pa, kPa, bar, psi, “in WC” (inches of water column in HVAC), mm Hg (vacuum and medical).
  • Sensor: gauge pressure transmitter, absolute pressure transmitter, or the static side of a differential transmitter.
  • Process examples: tank head pressure, pump suction/discharge static, distillation column pressure, HVAC duct static.

Dynamic Pressure: Kinetic Energy and Its Formula

Dynamic pressure is the kinetic energy of the moving fluid expressed as a pressure. For an incompressible flow at low Mach number:

q = ½ ρ v²

  • ρ = fluid density (kg/m³)
  • v = local fluid velocity (m/s)
  • q = dynamic pressure (Pa)

Dynamic pressure is zero when the fluid is at rest, and rises with v². Doubling velocity quadruples the dynamic head — which is why orifice plate, Venturi, and Pitot-style DP flow meters are intrinsically square-root devices, not linear ones. The 4–20 mA output that drives the loop has to be linearised in the transmitter or the DCS; see our linear-to-sqrt converter tool for the math.
For air at standard density (1.20 kg/m³) and 10 m/s in a duct, q = 0.5 × 1.20 × 100 = 60 Pa. For water at 1000 kg/m³ and 2 m/s in a pipe, q = 2000 Pa = 2 kPa. The factor of 800× between gas and liquid dynamic head explains why air-velocity Pitot tubes need very sensitive DP cells while water-velocity Pitots can use standard-range transmitters.

Total Pressure and Bernoulli’s Equation

Total pressure is the static + dynamic sum at a point. It is also the pressure you would read if you could decelerate the fluid to zero velocity isentropically — no friction, no heat exchange. Bernoulli’s equation says total pressure is conserved along a streamline of a steady, incompressible, frictionless flow:

ps + ½ρv² + ρgz = constant

The ρgz term is the elevation head; in a horizontal pipe or HVAC duct it drops out and the equation simplifies to p0 = ps + q. In real pipes, friction and turbulence make total pressure decrease in the flow direction — that decrease is the line’s friction head, which is what pumps and fans actually have to provide. The relationship between line static pressure and the resulting flow is covered in detail in our flow rate and pressure reference.

For compressible flows above Mach 0.3, the simple formula understates total pressure. Aerodynamicists use the isentropic relation p0/ps = (1 + (γ−1)/2 × M²)γ/(γ−1). For most HVAC and process work, Mach is well under 0.1 and the incompressible form is fine.

Pitot-Static Tube Anatomy: Which Port Reads Which

A Pitot-static probe is two tubes in one body. The forward-facing impact port stagnates the flow at the tip and reads total pressure p0. The flush side holes — typically a ring of 4 to 8 — read the wall static ps. A DP transmitter across the two ports outputs the dynamic head q directly. From q you back out velocity by v = √(2q/ρ).

Misalignment costs accuracy fast. A ±5° yaw on a single-port Pitot is roughly 1% error on velocity; ±15° is closer to 8–10%. Averaging Pitot tubes (Verabar, Annubar, V-cone variants) place multiple impact ports across a chord to reduce both alignment sensitivity and the impact of non-uniform velocity profiles. For straight-pipe rules see our flow-meter straight-pipe requirements note, and our V-Cone flow meter page for the contraction-based variant.
Static Pressure in HVAC Fans and Ducts

In HVAC, “static pressure” is almost always referenced to the duct wall, and the design target is the pressure the fan has to supply to overcome the system resistance. Typical numbers:

  • Residential furnace / AC: 0.5 in WC (125 Pa) is a common rated external static pressure.
  • Light commercial RTU: 0.8–1.5 in WC (200–375 Pa).
  • VAV systems at the fan: 2–4 in WC (500–1000 Pa).
  • High-pressure plenum or dust collection: 6–10 in WC (1.5–2.5 kPa).

“Total” external static pressure on a fan curve is supply-side static plus return-side static, both measured to the duct wall — not the velocity pressure. Velocity pressure (the dynamic head from the fan outlet) is separate, and fan-total pressure rise is the sum of the two. Confusing the two is the most common HVAC commissioning mistake. For chilled-water side energy accounting, see how flow and ΔT combine in our BTU meter for chilled water note.

What Pressure Gauges Actually Measure

A standard process gauge, gauge transmitter, or absolute transmitter mounted on a wall tap reads static pressure. The diaphragm sees fluid normal to its face from a side port, so the kinetic component has no projection onto the sensing surface.

To read dynamic or total pressure you need a probe that intentionally faces the flow:

  • An impact port alone (a forward-facing tube) reads total pressure.
  • A static wall tap reads static pressure.
  • The DP between an impact port and a static port reads dynamic pressure directly.
  • A differential pressure flow calculation across an orifice, Venturi, or V-cone is the same physics — Bernoulli applied across an area contraction.

HVAC Duct Velocity From a Pitot Traverse

Round duct, 400 mm ID, supply air at 25 °C. Pitot-static traverse shows an average dynamic head of 38 Pa across the standard log-Chebyshev points. What is the air velocity and volumetric flow?
  1. Air density at 25 °C ≈ 1.184 kg/m³.
  2. v = √(2q/ρ) = √(2 × 38 / 1.184) = √(64.2) = 8.01 m/s.
  3. Cross-section A = π(0.4/2)² = 0.1257 m².
  4. Q = v × A = 8.01 × 0.1257 = 1.007 m³/s = 3623 m³/h = 2133 CFM.

If the air is hotter or cooler than 25 °C, correct ρ before computing v. Around 80 °C supply air the density is ~12% lower, which gives a ~6% higher velocity for the same measured dynamic head — small but enough to matter for VAV setpoints.

Three Misconceptions Engineers Still Get Wrong

  1. “Dynamic pressure is what a gauge reads when the fluid is moving.” No — a wall-mounted gauge reads static pressure whether the fluid moves or not. Dynamic head only shows when a forward-facing impact probe is involved.
  2. “Total pressure equals static pressure plus the pump pressure.” No — total pressure is the energy per unit volume at a point, not a pump-curve quantity. The pump curve specifies the pressure rise (Δp0) it adds between suction and discharge.
  3. “At higher velocity the static pressure goes up.” The opposite. By Bernoulli, where v rises (e.g. at an orifice throat or in a Venturi neck) static pressure falls so that total pressure stays constant. That fall is exactly what DP flow meters measure.

FAQ

What is the difference between static and dynamic pressure?

Static pressure is the force the fluid exerts on a surface that is not moving with the flow. Dynamic pressure is the kinetic-energy contribution from the fluid’s motion, ½ρv². The two add to give total pressure: p0 = ps + ½ρv².

What is the difference between static pressure and dynamic pressure in a fan?

Fan static pressure is the wall-referenced pressure the fan must supply to push air through the ductwork against system resistance. Fan dynamic pressure (also called velocity pressure) is the kinetic head at the fan outlet, ½ρv² evaluated at outlet velocity. Fan-total pressure rise is the sum — and is what the fan curve plots against flow.

Do pressure gauges measure static or dynamic pressure?

Standard wall-mounted process gauges and transmitters read static pressure. To read dynamic pressure you need a Pitot-style probe wired through a DP transmitter across the impact and static ports. To read total pressure alone you need a forward-facing impact port without a paired static port.

What is total pressure used for?

Total pressure is used in aerodynamics (airspeed via Pitot tube), turbomachinery (compressor and turbine inlet/outlet states), and as the reference for Bernoulli energy balances. In incompressible HVAC and water systems, total pressure equals static + dynamic and is the quantity conserved between two points on a frictionless streamline.

Why do flow meters need dynamic pressure?

DP-type flow meters (orifice plate, Venturi, V-cone, Pitot, averaging Pitot) infer velocity from the dynamic head created by an area change or a stagnation point. Q = K √(ΔP/ρ), so the meter is intrinsically square-root and needs accurate density correction for compressible fluids.

SMT3151 Gauge Pressure Transmitter

±0.075% FS | 4–20 mA HART | Reads static pipe/tank pressure to atmosphere, configurable range from kPa to MPa.

SMT3151DP DP Transmitter

±0.075% FS | 4–20 mA HART | Pairs with Pitot or orifice ports to deliver dynamic head; spans from 0–0.5 kPa up to 0–40 MPa.

Verabar Averaging Pitot

DN50–DN3000 | Multi-port impact + static | Built-in DP output for direct dynamic-head reading on liquid, gas, and steam.

Need a Pressure or Pitot Tube Sized for Your Process?

Whether you need a static gauge transmitter, a DP cell for a Pitot or orifice, or an averaging Pitot probe in carbon-steel or 316L, send the line size, fluid, and design velocity to our engineers — we’ll quote ranges, accuracy class, and process connection together.

Request a Quote

Please enable JavaScript in your browser to submit the form

LPM to GPM & GPM to LPM: Conversion Table, Formula & Decoder

GPM and LPM are the two flow-rate units printed on almost every industrial pump, valve, and flow meter datasheet. GPM means gallons per minute (US gallons unless the label says otherwise). LPM means litres per minute. The conversion between them is one multiplication, but a small slip — the wrong gallon, the wrong rounding, mass instead of volume — turns a sized line item into the wrong meter on the skid. This page gives the conversion both ways, the lookup tables, and the industrial context the calculator sites don’t.

Contents

The Conversion Number You Need

One US gallon equals 3.785411784 litres exactly (NIST). Per minute, the conversion is the same number:

  • LPM → GPM (US): multiply LPM by 0.264172. Or divide LPM by 3.7854.
  • GPM (US) → LPM: multiply GPM by 3.7854.
  • LPM → GPM (UK): multiply LPM by 0.219969. UK gallon is 4.54609 L.
  • GPM (UK) → LPM: multiply GPM by 4.54609.

For a quick worked example: a chilled-water pump rated at 150 LPM puts out 150 × 0.264172 = 39.6 US GPM, or 33.0 UK GPM. That 6.6 GPM gap is the gotcha discussed below.

LPM ↔ GPM Conversion Tables (Both Directions)

Common values, rounded to two decimals. Use US gallons unless your meter or local code specifies UK Imperial.

LPMGPM (US)GPM (UK)
10.260.22
51.321.10
102.642.20
205.284.40
5013.2111.00
10026.4222.00
15039.6333.00
20052.8343.99
25066.0454.99
500132.09109.98
1000264.17219.97
GPM (US)LPMGPM (UK)
13.790.83
518.934.16
1037.858.33
1556.7812.49
2594.6420.82
50189.2741.63
75283.9162.45
100378.5483.27
200757.08166.53
5001892.71416.34

If your application is around flow rate and pressure sizing — for instance HVAC chilled-water or boiler feed — confirm which gallon the pump curve uses before you multiply.

What “GPM” Actually Means as a Unit

GPM is the symbol for gallons per minute. It is a volumetric flow rate — volume per unit time — not a mass flow rate. The “G” is gallons, which is a non-SI unit used mostly in the United States and the United Kingdom. The “PM” is per minute. The full ISO-equivalent expression is gal/min, sometimes written gpm or USgpm to disambiguate the gallon.

The SI counterpart is m³/s, but at industrial flow rates the operational units are LPM (L/min), m³/h, or GPM. On a chilled-water loop the same flow can be written 150 LPM, 9 m³/h, or 39.6 US GPM — same fluid, same pipe, three labels.

US Gallon vs UK Gallon: The 20% Gotcha

The US liquid gallon is 3.7854 L. The UK Imperial gallon is 4.5461 L. The Imperial gallon is about 20.1% larger. That means 100 GPM (UK) is 120 GPM (US) — same physical flow, different number on the label.

Procurement pitfalls we see in field installations:

  • A UK-sourced pump rated 40 GPM is actually 48 US GPM. Sizing the meter to 40 US GPM under-ranges the meter and clips the high end.
  • Conversion code that hard-codes the US factor (0.2642) treats Imperial gallons as US, producing a 20% under-reading.
  • Auto-translated datasheets from European OEMs sometimes drop the “UK” prefix when localising for North America. Always confirm by checking against L/min on the same sheet.

GPM vs LPM on Flow-Meter Spec Sheets

Which unit appears on the meter face depends on where it’s sold and what fluid it handles. Practical pattern after looking at hundreds of vendor PDFs:

Meter TypeTypical Native UnitNotes
Magmeter (water, slurry)m³/h or LPM (EU/Asia); GPM (US)Configurable on the transmitter display.
Variable-area rotameterGPM or LPM on the etched scaleScale is fluid- and SG-specific; not switchable.
Ultrasonic clamp-onm³/h or LPM (EU); GPM (US)Software-switchable.
Turbine / paddle wheelPulses, scaled to GPM in US, LPM in EUK-factor sets the pulse-to-volume ratio.
Corioliskg/h or g/s (native mass); GPM/LPM via densityGPM only valid at the configured density.

Variable-area meters such as the metal-tube rotameter are the only common type where the unit is physically etched onto the body. Anything with a display can usually toggle between LPM, GPM, and m³/h in the transmitter settings.

Spec-Sheet Decoder: 0.5–25 GPM in Pipe-Size Terms

A range like “0.5 to 25 GPM” tells you the meter, not the pipe. To pick the right line size you cross-reference target velocity. For water, the design rule of thumb is 1–3 m/s in process lines and 1.5–2.5 m/s in chilled-water mains.

Flow Range (GPM)LPMSuggested Line Size (Water, ~2 m/s)
0.5–52–19DN15 (½”)
2–208–76DN20 (¾”)
5–5019–189DN25 (1″)
15–15057–568DN40 (1½”)
30–300114–1136DN50 (2″)
80–800303–3028DN80 (3″)

Velocity has to land inside the meter’s specified turndown — typically 10:1 for vortex, 20:1 for paddle wheel, 100:1 for magmeter and Coriolis. The straight pipe requirements upstream and downstream of the meter also matter; under-piped installs invalidate the accuracy curve even when the range looks right on paper.

For pulse-output turbine and paddle-wheel meters, the displayed GPM or LPM depends on the configured K-factor. A K-factor entered in pulses/litre while the display reads GPM throws everything off by the 0.2642 factor.

Other Flow-Rate Units: m³/h, CFM, BPH

GPM and LPM are not the only labels you will see. The common cross-references:

  • m³/h (cubic metres per hour): 1 m³/h = 16.667 LPM = 4.403 US GPM. Standard for water utilities and EU process plants.
  • L/s (litres per second): 1 L/s = 60 LPM = 15.85 US GPM. Used in firefighting and large pumps.
  • CFM / SCFM: cubic feet per minute. Gas units — not interchangeable with GPM. 1 CFM ≈ 28.32 LPM only for actual volume, not standard volume.
  • BPH (barrels per hour): oil & gas. 1 US barrel = 42 US gal, so 1 BPH = 0.7 GPM = 2.65 LPM.
  • BTU/h: not flow, but flow-derived; for a chilled-water loop, see how the math chains in our BTU meter for chilled water note.

Mass vs Volumetric: When GPM Misleads

GPM is volume per minute. Volume changes with temperature and pressure, so for gases and compressible or hot liquids, the GPM number tells you less than you think.

  • Hot water at 90 °C is about 3.6% less dense than at 20 °C. A pump rated 100 GPM cold delivers ~96 GPM of cold-water-equivalent mass when hot.
  • For hydrocarbons the temperature correction is bigger (β around 0.001/°C for light products). Custody-transfer specs in oil & gas always state the reference temperature.
  • For gases, “GPM” is meaningless unless converted to Nm³/h or kg/h at a stated reference condition. Don’t size a gas process on a GPM figure.

Coriolis and thermal mass meters measure mass directly and avoid this problem. For volumetric meters, apply a density correction or use the inverse-square-root scaling from our linear-to-sqrt converter tool when working with DP-type meters.

Three Common Conversion Mistakes

  1. Mixing US and UK gallons. An OEM datasheet that says “GPM” with no qualifier in a UK or Commonwealth context is usually UK Imperial. North American docs are usually US. When in doubt, compute the LPM equivalent both ways and see which one matches the rest of the sheet.
  2. Using GPM for gas flow. GPM is volumetric and only meaningful for incompressible liquids at a known density. For air, nitrogen, or refrigerant gas, work in Nm³/h, kg/h, or SCFM and document the reference conditions.
  3. Rounding 0.2642 to 0.25. The shortcut “divide by 4” gives a 5.4% error. For custody transfer and BTU calculations that error is enough to fail audit. Use 0.26417 or the full factor.

FAQ

How many LPM is 1 GPM?

1 US GPM is 3.7854 LPM. 1 UK GPM is 4.5461 LPM. If the unit is not specified, US is the safer default for North American equipment and UK for UK/Commonwealth equipment.

How do you convert LPM to GPM by hand?

Multiply litres per minute by 0.2642 for US gallons. Multiply by 0.2200 for UK Imperial gallons. To go the other way, multiply GPM by 3.7854 (US) or 4.5461 (UK) to get LPM.

What’s the difference between GPM and LPM?

Both are volumetric flow-rate units. GPM is gallons per minute (3.7854 L per US gallon, 4.5461 L per UK gallon). LPM is litres per minute. LPM is SI-derived and used globally except in US and UK pumping/HVAC contexts.

Is GPM US or UK by default?

Defaults depend on the document’s origin. US OEM datasheets and most online calculators default to US GPM. UK and historically Commonwealth specs default to UK Imperial. ISO standards always state SI units; if a non-SI gallon is used, the document should specify US or UK explicitly.

Does the conversion factor change with temperature?

The volume-to-volume factor (0.2642 LPM-to-GPM US) is a pure unit conversion and does not change with temperature. Mass flow does change with temperature because density changes — that is a separate correction layered on top of the volumetric conversion.

Magnetic Flow Meter

DN15–DN3000 | ±0.2–0.5% | Configurable GPM, LPM, m³/h — switchable on the transmitter for conductive liquids and slurries.

Metal Tube Rotameter

DN15–DN200 | ±1.5–2.5% | Direct GPM or LPM etched scale — variable area for high-temp or opaque fluids.

Ultrasonic Water Meter

DN15–DN50 | ±2% | Battery-powered ultrasonic, displays GPM/LPM/m³/h, suitable for residential and commercial water billing.

Need a Flow Meter Sized in Your Units?

If your pump curve is in LPM and your local procurement spec is in GPM (or vice versa), send the line size, fluid, and design flow to our engineers — we’ll quote a meter with the display configured in the unit your operators read.

Request a Quote

Please enable JavaScript in your browser to submit the form

Sulfuric Acid Storage Tank Level: Radar Antenna & Overfill Guide

Sulfuric acid storage tanks combine three measurement obstacles: corrosive vapor in the headspace, concentration-dependent material compatibility, and regulated overfill protection. Direct-contact float and capacitance probes corrode within months. Non-contact 80 GHz radar with the right antenna material handles 96-98% concentrated H2SO4 indefinitely. This guide covers the technology decision, the antenna material matrix, and the install rules that pass EPA/SPCC inspection.

Contents

Why Sulfuric Acid Tank Level Is Hard to Measure

Three properties of stored H2SO4 fight standard level sensors. The concentrated acid (typically 93-98% commercial grade) is hygroscopic and pulls water from the atmosphere, releasing dense acid mist into the tank headspace. The mist condenses on any metallic part above the liquid — including the antenna and flange of a standard radar. The acid itself attacks 316 stainless, PVC, and most elastomer seals within weeks at > 60 °C. And acid storage is regulated: SPCC (40 CFR 112) and many state EPA rules require independent overfill protection beyond the primary level reading.

Non-contact radar handles all three obstacles when the antenna and process seal are specified correctly. The radar mounts above the maximum liquid level, so only the antenna face and the wetted seal see acid mist. Pick the wrong antenna material and corrosion eats it in a year; pick PTFE or PVDF and the unit runs 10+ years. The same lens architecture that survives blast furnace radar level service applies here, just with a chemical-resistant material swap.

Radar vs Ultrasonic vs DP vs Magnetostrictive: Decision Matrix

TechnologyWetted parts98% H2SO4 suitable?Acid-mist tolerant?Notes
80 GHz radar (PTFE/PVDF/Hastelloy)Antenna face onlyYesYes (sealed cavity)Recommended default
Ultrasonic (PVDF)Transducer faceBorderline (acid mist degrades sensor)PoorAvoid in concentrated service
DP / hydrostatic (PTFE diaphragm)Diaphragm seals on impulse linesYesN/A (sees acid directly)Reliable but plumbing intensive
Magnetostrictive (PTFE float)Probe in tankYes (PTFE rated)YesFloat can stick on viscous oleum
Capacitance (uncoated)Probe in tankNoNoCorrodes in months
Float / level switch (uncoated)MechanicalNoNoUse only as overfill backup, PTFE only

Most modern installations use 80 GHz radar as the primary measurement plus a PTFE magnetostrictive or float switch as independent overfill backup. The two technologies satisfy SPCC requirements for redundancy without duplicating wear-path components.

Antenna Material Selection by Concentration

H2SO4 concentrationTemperatureRecommended antennaLifetime
< 30%AmbientPVDF or PTFE lens10+ years
30-70%AmbientPVDF lens, sealed cavity5-10 years
70-98%AmbientPTFE lens with metal back-shield5-10 years
98% (concentrated)> 150 °CHastelloy C-276 horn or lens5+ years
Oleum (fuming H2SO4)AnyHastelloy C-276 + dedicated purge5+ years

PVDF (polyvinylidene fluoride) covers most ambient-temperature service economically. PTFE (Teflon) handles up to 98% acid but loses mechanical strength above 150 °C. Hastelloy C-276 is the only commonly available metallic antenna that survives both concentrated H2SO4 and oleum — expect a 3-5x cost premium over PVDF.

Acid Mist Handling and Antenna Sealing

Acid mist condenses inside any cavity that drops below the dewpoint of the tank vapor. On a 60 °C summer day with 95% H2SO4 storage, that dewpoint hovers around 40-50 °C. The antenna housing internals can fall below this if mounted in shade. Mist condenses, drips back onto the antenna face, and over weeks etches the lens. The fix is a fully sealed metal cavity with PTFE shielding between the wave-guide and the housing electronics. Specify on the data sheet:

  • Metal cavity behind the antenna face (typically PVDF or Hastelloy)
  • PTFE diaphragm or seal isolating the wave-guide from electronics
  • O-ring material: Viton for < 70% H2SO4, Kalrez for > 70%
  • Optional purge port for periodic dry-N₂ cleanout (low flow, < 0.1 Nm³/h)

On open vented tanks where mist concentration is highest, consider a stilling-well-style nozzle extension to keep the antenna face physically above the worst of the mist plume. The same logic applies on stilling-well radar installations in water service, just with chemical-grade materials.

Installation Rules for H2SO4 Tanks

  • Mount the radar 200-500 mm above the maximum fill level so the antenna face never dips into the acid during sloshing.
  • Use a DN80 or larger nozzle to keep the beam clear of the nozzle wall (avoid internal reflections).
  • Tilt 0-3° off vertical only if the tank has significant agitation surface waves.
  • Run the cable in PVC conduit or acid-resistant cable trays — standard PVC jacket softens in continuous acid-vapor exposure.
  • Provide a Ball-valve isolation under the radar flange so the unit can be removed without venting the tank.
  • Tighten flange bolts to spec with PTFE-impregnated gasket; standard graphite gaskets carbonize in concentrated acid service.

For multi-tank farms, mount each radar with identical orientation and nozzle geometry so spare units are interchangeable. Wiring conventions for the 4-20 mA HART signal follow standard practice; the special handling is in the mechanical install.

Overfill Protection and EPA / SPCC Compliance

SPCC plans (40 CFR 112) require for any oil tank, and most state programs extend the rule to acid storage: two independent level measurements when capacity exceeds 1320 US gallons. Best practice is one continuous radar level transmitter for control + one independent high-level switch wired directly to a shutoff valve. The switch must be on a separate power feed and a separate transmitter loop so radar failure does not disable the overfill protection.

  • Primary: 80 GHz radar, 4-20 mA to control system
  • Secondary: PTFE-coated float switch at 95% capacity, wired to inlet valve solenoid
  • Independent power supplies (instrument bus + UPS-backed)
  • Annual function test logged per calibration record requirements
  • Audible/visual high-high alarm on the local panel

Common Measurement Errors on Acid Tanks

  • Wrong antenna material. 316SS antennas show pitting within 90 days in 98% H2SO4 service. Switch to PTFE or Hastelloy.
  • Standard graphite flange gaskets. Carbonize in concentrated acid; switch to PTFE-impregnated.
  • Mounting too close to fill nozzle. Splashing on the antenna causes echo loss during fill. Move to opposite end of the tank.
  • Ignoring 4 mA ↔ 0 mm calibration drift. Acid stratification (heavier at bottom) shifts apparent density on DP backup — re-zero on a quiet tank.
  • No bund-level sensor. Secondary containment for acid storage is mandatory in most jurisdictions; a separate low-cost underground / bund level indicator catches spills before they migrate.

80 GHz Radar Level Transmitter

Non-contact 80 GHz radar | PTFE or Hastelloy antenna option | 4-20 mA HART — recommended for 70-98% H2SO4 storage with acid-mist headspace.

SI-302 Anti-Corrosive Submersible Transmitter

PTFE-coated diaphragm | Range 0-200 m H2O | for dilute acid < 30% where direct-contact submersion is acceptable. Not for concentrated H2SO4.

Stainless-Steel Hydrostatic Level Sensor

316L wetted parts | Optional Hastelloy / PTFE upgrades | DP head measurement for tanks where top-mounting radar is impractical.

FAQ

What sensor measures sulfuric acid tank level?

Non-contact 80 GHz radar with a PTFE or Hastelloy antenna is the current standard for concentrated H2SO4 (70-98%) storage. Dilute acid (< 30%) accepts PVDF radar or PTFE-coated submersible pressure level transmitters.

Does sulfuric acid corrode radar antennas?

Standard 316SS or PVC antennas pit and crack within months in 98% acid. PVDF resists dilute acid; PTFE handles up to 98% at ambient; Hastelloy C-276 covers concentrated and hot service (> 150 °C) and oleum.

Why is a metal cavity needed inside the radar?

Acid mist condenses inside any cavity below the headspace dewpoint and drips onto the antenna face. A sealed metal cavity with a PTFE diaphragm isolates the antenna from the electronics, so condensation cannot reach the wave-guide internals.

Do I need overfill protection separate from the radar?

Yes for tanks > 1320 US gal under SPCC and most state EPA rules. Install one continuous radar level transmitter plus an independent PTFE float switch at the high-high level, on separate power feeds and wired to an automatic shutoff.

Sizing a radar for 98% H2SO4 storage, oleum service, or a mixed-concentration tank farm? Send the tank diameter, fill rate, and acid concentration — our chemical instrumentation engineers reply with antenna material, nozzle spec, and overfill scheme within one business day.

Request a Quote

Please enable JavaScript in your browser to submit the form

Blast Furnace Radar Level Measurement: 80 GHz Design, Purge & Install

Blast furnace stockline measurement runs at 1200 °C inside, with dust, hydrogen-rich gas, and constant charging dynamics. Mechanical sounding rods and isotope sources have given way to 80 GHz FMCW radar as the standard since around 2018. This guide covers how the radar survives furnace conditions, what the purge system must deliver, and how to specify a unit for blast furnace, CDQ, BOF, and torpedo car service.

Contents

Why Blast Furnace Level Is Hard to Measure

Three conditions defeat conventional level sensors. The throat sits at 200-400 °C continuous, with raw materials at 800-1200 °C below the burden line. Hot reducing gas (CO + H₂) flows upward at 5-15 m/s. And during charging, 50-100 t of coke and ore land in seconds, generating dust clouds that scatter ultrasonic and laser beams. A corrosive tank radar setup is mild by comparison — the blast furnace adds heat and impact load on top.

Radar at 80 GHz cuts through dust because the wavelength is 3.75 mm. Particle sizes that dominate in furnace dust (10-100 µm) are too small to scatter the beam significantly. Compared with 26 GHz radar (wavelength 11.5 mm), the 80 GHz beam stays focused and returns a clean echo from the burden surface.

Frequency Comparison: 80 GHz vs 120 GHz vs Lower Bands

FrequencyWavelengthBeam angleBest useLimitation
6 GHz50 mm10-15°Clean liquids, large tanksHeavy dust scatter
26 GHz11.5 mm6-8°Bulk solids, moderate dustEcho loss in heavy dust
80 GHz3.75 mm3-4°Blast furnace, CDQ, BOFHigher unit cost
120 GHz2.5 mm2-3°Narrow openings, small silosLimited model availability

For a blast furnace throat 6-10 m wide with charging in progress, 80 GHz balances beam concentration with proven manufacturer support. 120 GHz wins only when the antenna must fire through a narrow nozzle smaller than 200 mm. Refer to the radar antenna selection guide for the matching antenna type.

FMCW vs Pulse Radar in Furnace Service

FMCW (Frequency Modulated Continuous Wave) transmits a chirp that sweeps 78-82 GHz over a few milliseconds. The return echo arrives shifted in frequency; that shift converts directly to distance. Pulse radar fires short bursts and times the round trip. For blast furnace use, FMCW dominates because the continuous chirp has lower peak power, longer averaging, and better signal-to-noise ratio against the dust background. Most modern 80 GHz blast furnace transmitters — Magnetrol Pulsar R80, Matsushima, Sino-Inst SIRD — are FMCW.

Mandatory Design Features for 1200 °C Service

  • Ceramic or PTFE lens antenna with 250 °C continuous rating at the antenna face.
  • Water- or air-cooled flange dropping the electronics housing to below 50 °C even when the process flange runs at 200-400 °C.
  • Forced-air purge inlet at the antenna to prevent dust adhesion. Pressure 0.1-0.3 MPa, dewpoint ≤ -20 °C.
  • Ball valve or knife valve isolation so the radar can be removed during planned shutdown without breaching furnace pressure.
  • 4-20 mA HART or Modbus RTU output with secondary digital diagnostics for clogging detection.
  • IEC 60079 (ATEX/IECEx) certification required where top-gas H₂ concentrations exceed flammability limits.

Match these features to the molten salt level service envelope — both applications share the high-temperature + flange-cooling architecture, only the dust profile differs.

Purge Air and Air-Cooling Specifications

The purge system is what keeps the antenna lens clean. Specify on the data sheet:

  • Air pressure: 0.1-0.3 MPa at the radar inlet (regulated, not unregulated plant air).
  • Flow rate: 5-15 Nm³/h continuous, with provision for periodic burst clearing at 30-50 Nm³/h.
  • Dewpoint: ≤ -20 °C to prevent condensation when air contacts the cooler lens surface.
  • Solenoid valve with time relay for cyclic purge during charging (e.g., 5 s burst every 30 s).
  • Cooling air for housing: separate line, 0.05-0.1 MPa, sized to hold electronics < 50 °C ambient.

Plants that share instrument air with the purge typically learn after the first lens fouling event to dedicate a dry compressor and refrigerated dryer to radar service. The cost of a 100 L instrument-grade dryer is recovered the first time the radar avoids a manual cleaning trip.

Installation Geometry on Top of the Furnace

Modern bell-less top (BLT) charging systems present a 6-10 m diameter throat with a chute rotating during charging. The radar must mount off-axis to avoid the chute path but still cover the burden centroid. Best practice:

  • Mount the antenna 1.5-3.0 m above the maximum stockline.
  • Offset from center by 1.0-2.0 m to avoid charging chute interference.
  • Tilt 2-3° toward the burden centroid; verify with the manufacturer beam plot.
  • Use a parallel sounding rod for the first month to confirm radar reading vs mechanical reference.

On tank installations the geometry is simpler — on a blast furnace the BLT mechanics force this off-axis compromise.

Range, Accuracy, and Output Signals

ApplicationRangeAccuracyOutput
Blast furnace stockline2-15 m±0.2% FS or ±5 mm (whichever greater)4-20 mA HART + Modbus
Torpedo car / BOF bath0.5-10 m±1 mm4-20 mA HART
CDQ (coke dry quench)2-25 m±0.2% FS4-20 mA HART
Raw material silo (top)2-30 m±0.2% FS4-20 mA HART

The 4-20 mA HART output is the universal interface to DCS. For SCADA integration via Modbus, confirm the device supports RTU over RS-485 in addition to HART. Some plants prefer the redundancy of running both protocols in parallel; see SCADA / DCS architecture basics for how the two layers consume the same primary measurement differently.

80 GHz Radar Level Transmitter

FMCW 80 GHz | Range 0.5-100 m | 3° beam | 4-20 mA HART — lens-antenna model rated for dust, steam, and furnace top conditions.

Radar Antenna Selection Guide

Horn, lens, rod, parabolic, drop antennas compared by tank diameter, dust load, and process temperature. Pick the right antenna for stockline service.

Guided-Wave Radar Calibration Guide

4-step bench calibration for high-pressure / high-temperature GWR probes. Use for hot-stove and CDQ install verification.

FAQ

What frequency radar works on a blast furnace?

80 GHz FMCW is the current standard for blast furnace stockline. The 3.75 mm wavelength cuts through furnace dust that scatters 26 GHz radar, and the 3° beam angle keeps the footprint contained on the BLT geometry. 120 GHz becomes attractive only for very narrow openings.

How is the radar protected from 1200 °C heat?

A high-temperature lens antenna (PTFE or ceramic) handles the throat temperature directly. The electronics housing sits on a cooled flange with continuous purge air, holding the housing below 50 °C even when the mounting flange reaches 250-400 °C.

What measurement range is typical for blast furnace radar?

2-15 m for stockline level on a typical mid-size blast furnace. Range extends to 25-30 m for CDQ and large raw material silos. Accuracy is ±0.2% of full scale, or ±5 mm at short range.

Does dust during charging cause measurement loss?

A properly purged 80 GHz radar tracks through charging dust. The FMCW chirp averages over the measurement window (typically 100-500 ms) and the digital signal processing rejects momentary echo loss. Burst purge timed to the charging cycle is the standard workaround.

Specifying a blast-furnace-rated radar for a new ironworks build or a hot-stove retrofit? Send the throat geometry, max stockline, and BLT type — our furnace instrumentation team replies with a sizing sheet within one business day.

Request a Quote

Please enable JavaScript in your browser to submit the form

4-20 mA to 0-10 V Converter: Resistor Table, Wiring & PLC Scaling

A 4-20 mA current loop carries a sensor signal across hundreds of meters with near-zero drift. A 0-10 V PLC card cannot accept that current directly. Converting between the two is a five-cent fix on the bench (one resistor) or a forty-dollar fix in the panel (a signal converter). This guide gives you the resistor table, the wiring diagram, the PLC wiring conventions, and the decision rule for picking each.

Contents

4-20 mA to 0-10 V Conversion at a Glance

Two paths exist. A precision resistor across the PLC analog input converts current to voltage by Ohm's law. An active signal converter does the same job but adds galvanic isolation and a true zero-based output. Pick the resistor for short cable runs and grounded single-PLC systems. Pick the converter when ground loops, long runs, or true 0-10 V output matter. Reviewing how a 4-20 mA transmitter generates the loop helps clarify why the live-zero matters.

One trap catches new technicians weekly: a 500 Ω resistor produces 2-10 V, not 0-10 V. The 4 mA live zero of the loop drops 2 V across 500 Ω. If the PLC card requires the input to start at 0 V (some 12-bit modules do, others scale from any value), the resistor method needs software offset or an active converter with zero adjustment.

Resistor Sizing Table for Common Output Ranges

Voltage at the PLC input equals current times resistance. The 4 mA endpoint sets the low voltage; 20 mA sets the high. Most plants standardize on 250 Ω (1-5 V) or 500 Ω (2-10 V) so spares interchange.

ResistorOutput @ 4 mAOutput @ 20 mASpanTypical PLC card
125 Ω0.5 V2.5 V0.5-2.5 VLow-voltage ADC, microcontroller
250 Ω1.0 V5.0 V1-5 VAllen-Bradley 1492-IFM, legacy DCS
500 Ω2.0 V10.0 V2-10 VSiemens S7-1200/1500 0-10 V mode
250 Ω + opamp offset0 V4 V0-4 VCustom analog front-end

Specify 1% or 0.1% metal-film resistors at 0.25 W or higher. At 20 mA through 500 Ω the dissipation is I²R = 0.0004 × 500 = 0.2 W, so a quarter-watt part is borderline; jump to 0.5 W if the resistor sits inside a hot panel. Wirewound and carbon-film parts drift with temperature and should not be used for analog instrumentation. The same precision rule applies whenever you read engineering units back from a sensor — resistor error multiplies straight into reported value.

Wiring the Resistor Across the PLC Analog Input

Three terminals do the work: the transmitter positive (+), the PLC analog input (AI), and the PLC common (COM). The resistor goes between AI and COM, the transmitter loop closes through the AI terminal.

  • Wire the transmitter + to the 24 VDC supply positive (most transmitters are loop-powered).
  • Wire the transmitter (current return) to the PLC AI terminal.
  • Wire the PLC COM terminal to the 24 VDC supply negative.
  • Install the precision resistor across AI and COM (parallel to the input impedance).
  • Keep the resistor lead length under 20 mm to limit thermal EMF and pickup noise.

On terminal blocks, mount the resistor on the panel side, not at the transmitter side. This keeps the 4-20 mA loop full-length (high immunity) and only the short voltage span sees the PLC. Our pressure transmitter installation guide covers the loop-powered vs self-powered (4-wire) wiring variants for reference.

PLC Scaling: Why 500 Ω Gives 2-10 V, Not 0-10 V

The 4 mA live zero is the cause. 4 mA × 500 Ω = 2 V. The PLC reads 2 V at the bottom of the sensor range, not 0 V. Two options correct this in software:

  • Two-point scaling: Engineering value = (raw_V − 2) / 8 × full_scale. The 8 is the 10-2 V span. Built into most modern PLC scale function blocks (SCL, SCP, FC105).
  • Offset correction: Add a -2 V offset before the standard 0-10 V scale block. Works on older HMIs that lack two-point scaling.

A common error is mapping 0-10 V raw counts directly to 0-100% engineering units. This compresses the live signal range to 80% and shifts zero by 20%. Field calibration will look fine at mid-scale and fail at endpoints, which is hard to diagnose without a multi-point bench calibration.

Signal Converter vs Resistor: Decision Matrix

A passive resistor wins on cost and simplicity. An active signal converter wins on isolation, true zero-based output, and long cable immunity. Use the matrix to pick.

CriterionResistor (passive)Signal converter (active)
Cost per channel< $1$30-$120
Galvanic isolationNone1500-3000 V typical
True 0-10 V outputNo (gives 2-10 V)Yes
Ground loop immunityVulnerableImmune
Cable length tolerance< 50 m typical> 500 m with shielded twisted pair
Field calibrationNone neededTrim pots or DIP switches
Failure modeOpen = no signal; short = full-scaleDiagnostic LED, fault output

A DIN-rail signal converter handles 4-20 mA ↔ 0-10 V either direction, with 24 VDC loop power, 2500 V isolation, and 0.1% accuracy. For hazardous-area service, look for an IECEx/ATEX zener barrier with isolated output in the same form factor. When the signal then feeds a SCADA-level analog input bank, the isolated converter also limits common-mode voltage entering the supervisory layer.

Reverse Path: 0-10 V to 4-20 mA

VFDs, lab power supplies, and HMI analog outputs often produce 0-10 V. Sending that signal to a DCS that expects 4-20 mA requires the reverse converter: a V/I converter chip (XTR110, AD694) on a board, or a packaged DIN-rail unit. Passive conversion is not possible — a resistor cannot generate a current loop. Loop power must come from somewhere, typically the DCS analog input itself or an external 24 VDC supply.

Common Mistakes in Field Installations

  • Resistor on the wrong side of the loop. Mounting at the transmitter cuts loop length immunity in half.
  • Using 250 Ω on a 0-10 V card. Output peaks at 5 V; PLC reads 50% at full sensor span.
  • Mixing carbon and metal-film resistors in spare-parts inventory. Temperature drift kills accuracy on outdoor panels.
  • Skipping isolation when sharing 0 V reference between multiple PLC racks. Ground loops appear as 50/60 Hz noise on the voltage signal.
  • Forgetting the live zero in PLC code. Process readings stuck at −25% LRV at idle are the symptom.

SI-300 Pressure Transducer (4-20 mA / Voltage)

Ranges 0-1000 bar | Output 4-20 mA, 0-5 V, 0-10 V | Accuracy ±0.25% FS — ships with selectable output for direct PLC wiring.

R7100 Universal-Input Paperless Recorder

Accepts 4-20 mA, 0-10 V, mV, RTD, thermocouple on the same channel — no resistor or converter required to log mixed-signal field instruments.

SI-512H High-Temperature Pressure Sensor

Process temp up to 800 °C | 4-20 mA two-wire output | Cooling fin design — for steam, hot oil, furnace headers feeding PLC analog inputs.

FAQ

What resistor converts 4-20 mA to 0-10 V?

A 500 Ω precision resistor gives 2-10 V, not 0-10 V, because the 4 mA live zero drops 2 V across 500 Ω. For a true 0-10 V output, use an active signal converter with zero adjustment, or apply two-point scaling in PLC code to handle the 2 V offset.

Why does 500 Ω not give 0 V at 4 mA?

Ohm's law: 4 mA × 500 Ω = 2 V. The 4 mA "live zero" is intentional. It lets the receiver detect a broken loop (0 mA = fault) versus a valid low reading. The 2 V offset must be handled in software or by an active converter.

What resistor for 4-20 mA to 1-5 V?

250 Ω. 4 mA × 250 Ω = 1 V; 20 mA × 250 Ω = 5 V. Specify 0.1% tolerance metal film, 0.25 W. The 1-5 V range was common on legacy DCS systems and still appears on some older Allen-Bradley 1771 modules.

Do I need an isolator between the sensor and PLC?

Yes, if the sensor and PLC share a long cable run (over ~50 m), if either device has a separate ground reference, or if 50/60 Hz hum appears on the signal. A DIN-rail signal isolator with 1500-3000 V galvanic isolation breaks the ground path.

Need spec help, a wiring drawing for a specific PLC, or a price on a DIN-rail signal converter? Send your project details — our instrumentation engineers reply within one business day.

Request a Quote

Please enable JavaScript in your browser to submit the form

Vertical Flow Meter Installation: Dos & Don’ts by Type | Sino-Inst

Updated May 21, 2026 — Yes, most flow meters can run on a vertical pipe — but only if you pick the right type and respect the orientation rules. A magnetic meter mounted with horizontal flow shows zero. A turbine wheel on a downward-flow line spins backwards. This guide covers vertical installation rules for every common technology, with field-tested examples and a checklist of the six mistakes engineers keep repeating.

For pulse-output meters in particular, the calibrated K-factor on the certificate must be entered into the transmitter in the matching volume unit, or readings drift by the gallon-to-litre conversion factor.

Contents

Vertical vs Horizontal Pipe: What Changes for the Meter

Three physics differences govern every vertical flow-meter decision:

  • Pipe-fill state. Horizontal pipes can run partially full at low flow; vertical pipes with upward flow are always full once flow exceeds the meter cutoff. Magnetic and ultrasonic meters need a full pipe.
  • Gas trapping. In a horizontal line, gas bubbles ride along the top. In a vertical upward line, bubbles rise out of the meter quickly. Downward flow traps bubbles against gravity and corrupts the reading.
  • Solids drop-out. On a horizontal pipe at low velocity, sand and scale drop to the bottom. Vertical pipes self-flush, so abrasive duty is more meter-friendly on a riser.

The rule of thumb: vertical upward flow is almost always preferred when you have the headroom. Vertical downward flow is acceptable only for ultrasonic and DP-orifice technology, and only with extra precautions.

Magnetic Flow Meter on a Vertical Pipe

Magnetic (electromagnetic) flow meters work well vertically when three conditions are met:

  1. Flow direction is upward. A full pipe is guaranteed; gas pockets cannot park at the electrode plane.
  2. Electrodes lie on a horizontal axis. The two measuring electrodes must be at the 3 and 9 o’clock positions so any trapped gas rides past the top, well above the sensing area.
  3. The fluid is conductive (>5 µS/cm). The meter still needs conductive fluid — vertical orientation does not bypass that physics. Match the same 5D upstream and 2D downstream rule you would use horizontally.

Mount the converter housing above the meter body or remote-mount it on a nearby wall. Direct sunlight on the converter on outdoor sites causes thermal drift; shade or paint the housing white.

Turbine and Vortex Meters on Vertical Runs

Turbine and vortex meters have a directional axis: they read accurately only in one flow direction. Mount with the arrow on the body pointing upward.

  • Turbine bearings handle vertical mounting with minor accuracy loss (about 0.2-0.5% added uncertainty) compared to horizontal.
  • Vortex meters perform equally well horizontal or vertical — the shedding bluff body is symmetric. Vertical upward flow is preferred on hot or steam service to avoid condensate accumulation at the meter throat.
  • Downward flow is allowed only at velocities high enough to keep the pipe full (typically >1.5 m/s); below that, gas pockets form at the inlet face.

Ultrasonic Clamp-On for Vertical Pipes

Ultrasonic transit-time meters are the most forgiving on vertical pipes:

  • No moving parts, no direction sensitivity at the sensor — the software handles flow direction.
  • Works on partial-fill horizontal pipes poorly; works on full vertical pipes excellently.
  • Mount transducers on the straight vertical run, at least 10D from any elbow or pump discharge.
  • Acoustic coupling gel dries faster on hot vertical pipes; pick a high-temperature paste rated to the actual pipe surface temperature. See our chilled water flow meter selection for cold-side counterparts.

Insertion ultrasonic versions hot-tap into a vertical pipe with a single 1-inch fitting. Useful for retrofits where the budget will not allow a spool break. The same fitting accepts our pressure transmitter installation hookup hardware.

Variable-Area Meters: Always Vertical

Rotameters and other variable-area meters require vertical upward flow by physics: the float position depends on gravity and drag balance. Mount any other way and the float seizes or reads wrong.

  • Vertical alignment must be within 2° of true plumb. Tilted rotameters under-read.
  • Allow at least 50 mm clearance above and below the meter for float travel and tube cleaning.
  • For gas service, double-check the float is rated for the actual gas density; meters scaled for air will mis-read by 30-50% on lighter gases like nitrogen or hydrogen. For volumetric vs mass selection, see our GPM to LPM conversion guide.

Six Vertical Installation Mistakes

  1. Magmeter electrodes vertical instead of horizontal. Trapped gas drifts across the electrode and chops the signal.
  2. Vertical downward flow without a pipe-full guarantee. Use a riser or add a U-trap downstream to maintain a wet meter at low flow.
  3. Pump discharge feeding meter directly. Pump pulsation breaks turbine and vortex accuracy; insert 10D of straight pipe or a flow conditioner.
  4. Rotameter tilted off plumb. Use a spirit level during install; do not eyeball.
  5. Ultrasonic clamp-on on a freshly painted pipe. Paint thickness shifts the transit-time calibration. Scrape to bare metal under each transducer pad.
  6. Skipping a strainer on slurry or condensate service. Vertical does not protect against scale and debris. See our DP transmitter installation guide for parallel rules.

Metal Tube Rotameter

DN15-DN150 | 4-20 mA HART | ±1.5% accuracy — ATEX option for hazardous areas, always vertical upward mount.

Insertion Ultrasonic Flow Meter

Hot-tap retrofit | DN50-DN2000 | ±1% accuracy — mounts on vertical or horizontal with no spool break.

Verabar Averaging Pitot

Insertion probe | DN25-DN2000 | low pressure drop — works on vertical or horizontal, suitable for steam, gas, and condensate.

Frequently Asked Questions

Can flow meters be installed vertically?

Yes, most flow meters can be installed on vertical pipes, but the rules differ by technology. Magnetic, turbine, vortex, ultrasonic, and rotameters all support vertical mounting when the meter axis is correctly aligned and the pipe is full. Downward flow is acceptable for some technologies but requires extra precautions to maintain a full pipe at the meter.

Why must a rotameter be vertical?

A rotameter is a variable-area meter where the position of a float depends on gravity balancing drag from upward flow. Mount it horizontally or tilted and the float either seizes or sits below scale. Vertical orientation within 2° of plumb is mandatory.

How do you install a magnetic flow meter on a vertical pipe?

Use upward flow to keep the pipe full. Orient the electrodes on a horizontal axis (3 and 9 o’clock) so trapped gas passes above the sensing area. Allow 5 pipe diameters of straight pipe upstream and 2 downstream, and shield the converter from direct sunlight.

Can water meters be installed vertically?

Most modern water meters — multi-jet, ultrasonic, electromagnetic — support vertical mounting. Older Woltmann turbine and oscillating piston designs may lose accuracy if not mounted as the manufacturer specifies, usually horizontal. Always check the meter datasheet and ensure flow is upward to keep the meter full.

What is the best flow meter for a vertical pipe?

Ultrasonic clamp-on or insertion ultrasonic for retrofit jobs without a spool break; electromagnetic with horizontal-electrode orientation for conductive liquids; rotameter for low flow or visual indication. Pick by fluid, flow range, and whether you need pressure-drop-free operation.

Need help selecting a flow meter for your vertical pipe? Send the pipe size, fluid, flow range, and orientation and our engineers will quote a meter that matches your installation within one business day.

Request a Quote

Please enable JavaScript in your browser to submit the form